Insights to act on
Stop guessing how your content performs. Moreover, understand what your audience watches and when, and how much revenue they generate with View TV Dashboard.
View TV Dashboard overview
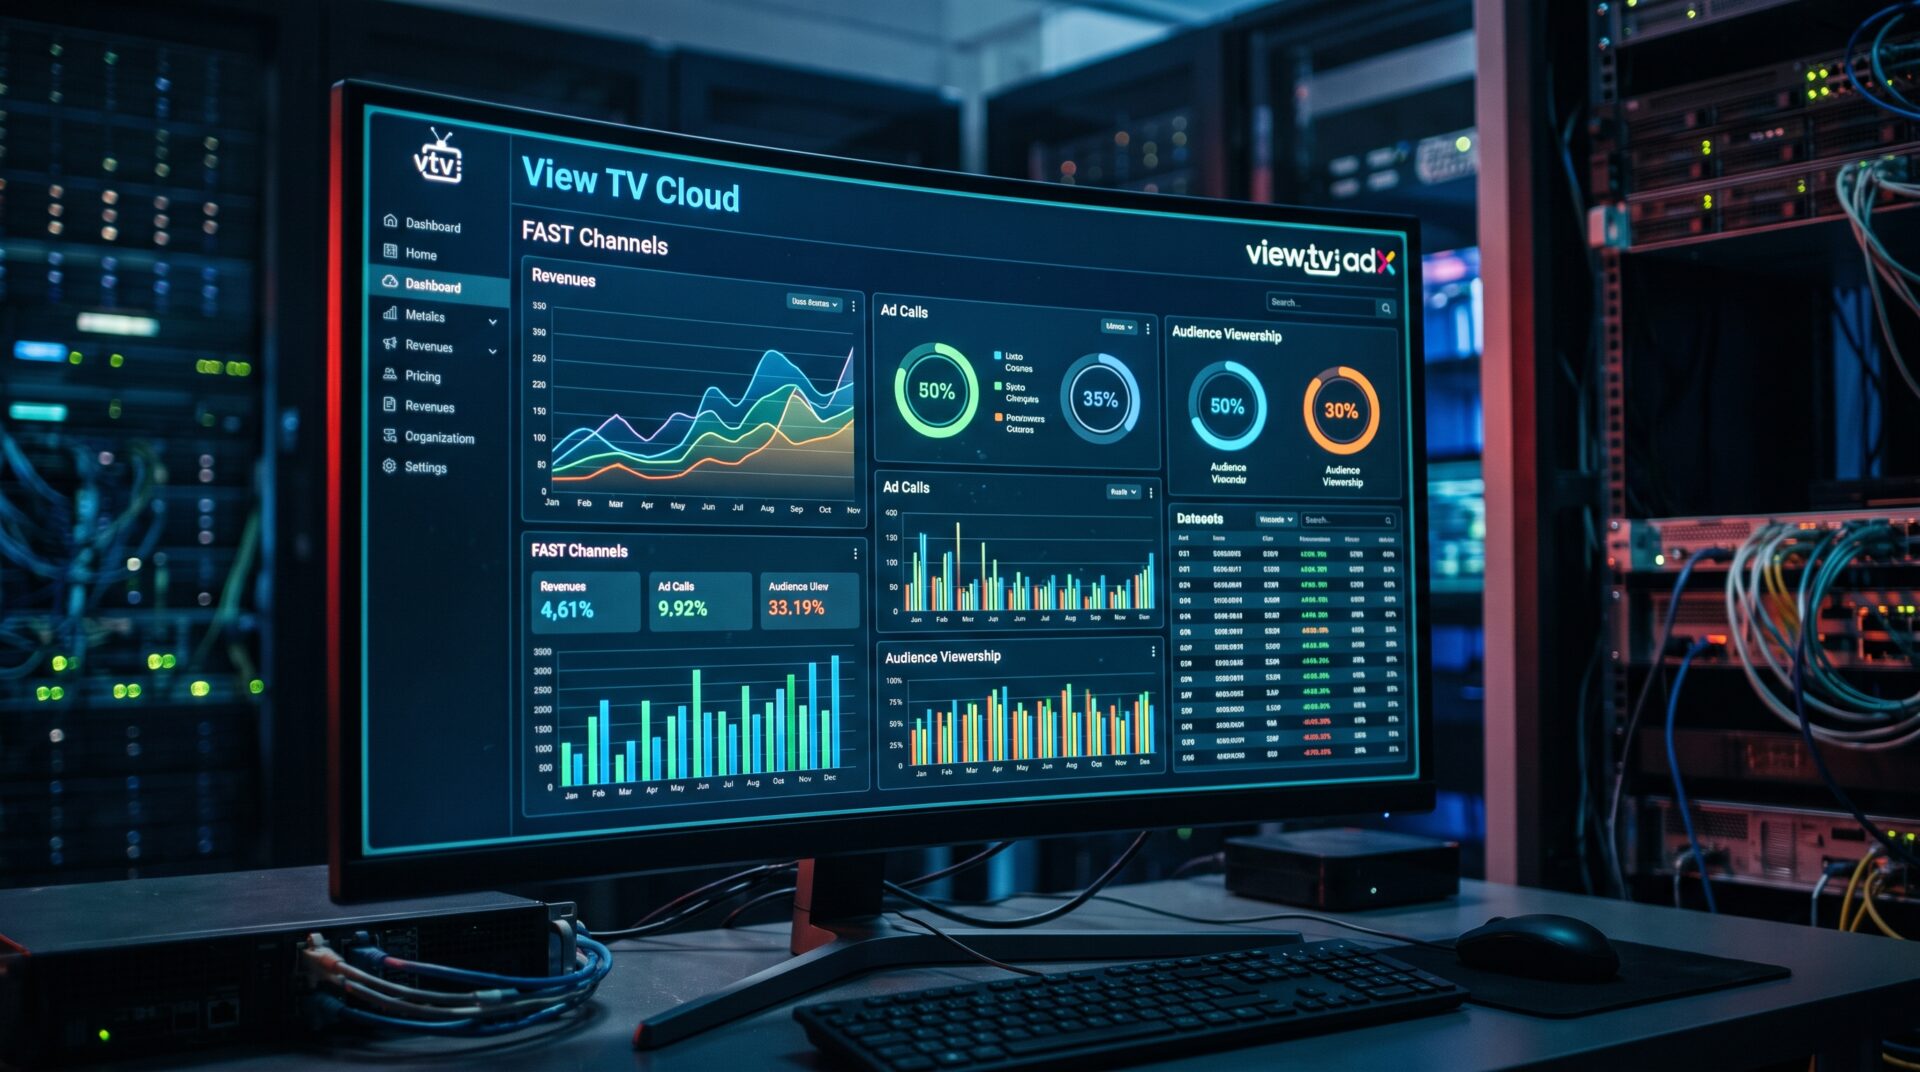
The View TV Dashboard brings together the latest performance data from content libraries and CTV channels. Moreover, it also integrates FAST networks into one intelligent, easy-to-use reporting platform.
Overview
Aggregating data from 12 sources, View TV Dashboard provides a consolidated view of the television business.
Moreover, it covers content owners, broadcasters, channel operators and advertisers, broken down per distribution point in a live update dashboard.
From DAVE (Daily Active Viewers Engaged) & Monthly Active Viewers Overall, depending on reporting period) and total viewing hours to RPM (revenue per 1,000 hours watched), the dashboard provides visibility into the commercial and audience performance of every channel and content library.
Key performance metrics include:
- Audience Intelligence: DAVE, active viewers, viewing hours and average viewing time.
- Revenue Performance: RPM, advertising revenue, sponsorship revenue and content monetisation.
- Device Analytics: Audience engagement across Smart TVs, streaming devices, mobile and connected platforms.
- Geolocation Intelligence: Understand exactly where audiences are watching, down to individual states and geographical markets.
- Peak Audience Analytics: Identify peak viewing periods, audience growth and tune-in/tune-out behaviour.
- Live Event Engagement: Measure real-time audience participation and viewing performance during live broadcasts.
- Sponsorship Performance: Track brand integration and sponsorship revenue alongside traditional advertising performance.
Ask Your Dashboard. Get Answers.
What makes View TV Dashboard different is its integrated AI reporting and consultancy capability.
Instead of simply presenting charts and spreadsheets, users can ask questions in natural language and receive intelligent analysis of the data being collected.
For example:
- “Why did people tune out at 7:10pm on Tuesday?”
- “How many total viewing hours did we generate in Texas last month?”
- “Which devices are delivering the highest average viewing time?”
- “Which channels have the highest RPM?”
- “When does our audience peak during the week?”
- “Which content libraries are generating the strongest revenue performance?”
The AI analyses the available datasets, identifies patterns and provides a consultative response to help operators understand what is happening and what they should consider doing next.
From Data Collection to Commercial Intelligence
View TV is bringing together 12 different first-party and third-party data points, removing the need for operators to log into multiple platforms, reconcile conflicting reports or manually build spreadsheets to understand their business.
The result is a single source of audience, content and revenue intelligence across the View TV ecosystem.
View TV Dashboard isn’t just another analytics platform. It’s an AI-powered business intelligence tool designed to help television operators make better commercial decisions, improve audience engagement and maximise content ROI.
View TV Dashboard. Know your audience. Understand your revenue. Make better television.
More will be release over the coming weeks!